SciChart Demo
라이브러리 및 데모 | SciChart
5억명 이상의 게이머가 신뢰하는 안드로이드 게임 플랫폼 BlueStacks으로 PC에서 플레이하세요.
SciChart Demo PC에서 즐겨보세요
이 예제 데모는 SciChart Android 기능 및 API의 유연성을 보여줍니다.
우리는 학습 사례로도 활용 될 수있는 여러 가지 사례를 만들었습니다.
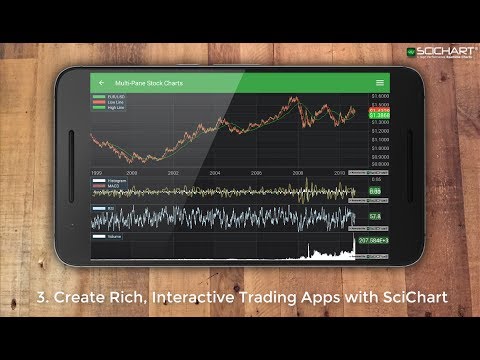
여기에는 간단한 2D Android 선, 산 및 산포 차트에서 고급 Android 3D 메시 및 폭포 그래프에 이르는 2D 및 3D의 기본 차트 유형 세트가 포함됩니다.
데모 예제에는 실시간 차트가 포함되어 있습니다. 대부분의 경우 센서의 실시간 데이터 시각화에 사용되는 경우와 같이 라이브러리의 속도와 성능을 보여줍니다. 이러한 예에는 실시간 티킹 주식 차트 데모 및 실시간 지오이드 메시 3D 시뮬레이션이 포함되지만 이에 국한되지는 않습니다.
SciChart에서는 도달 범위 및 대화식 응용 프로그램을 만들 수 있으며, 툴팁, 롤오버 및 레이블과 같은 대화 형 기능을 차트에 추가하여 카메라 설정을 이동 및 확대 / 축소하고 변경할 수있는 방법을 보여줍니다.
이러한 각 기능에는 독립적 인 예제가 작성되었습니다.
마지막으로, SciChart는 8 개의 테마를 기본적으로 제공하며, 자신 만의 테마를 만들거나 차트의 모든 요소를 독립적으로 스타일링 할 수있어 차트 구성 요소의 모양과 느낌을 원하는대로 얻을 수 있습니다.
우리는 학습 사례로도 활용 될 수있는 여러 가지 사례를 만들었습니다.
여기에는 간단한 2D Android 선, 산 및 산포 차트에서 고급 Android 3D 메시 및 폭포 그래프에 이르는 2D 및 3D의 기본 차트 유형 세트가 포함됩니다.
데모 예제에는 실시간 차트가 포함되어 있습니다. 대부분의 경우 센서의 실시간 데이터 시각화에 사용되는 경우와 같이 라이브러리의 속도와 성능을 보여줍니다. 이러한 예에는 실시간 티킹 주식 차트 데모 및 실시간 지오이드 메시 3D 시뮬레이션이 포함되지만 이에 국한되지는 않습니다.
SciChart에서는 도달 범위 및 대화식 응용 프로그램을 만들 수 있으며, 툴팁, 롤오버 및 레이블과 같은 대화 형 기능을 차트에 추가하여 카메라 설정을 이동 및 확대 / 축소하고 변경할 수있는 방법을 보여줍니다.
이러한 각 기능에는 독립적 인 예제가 작성되었습니다.
마지막으로, SciChart는 8 개의 테마를 기본적으로 제공하며, 자신 만의 테마를 만들거나 차트의 모든 요소를 독립적으로 스타일링 할 수있어 차트 구성 요소의 모양과 느낌을 원하는대로 얻을 수 있습니다.
PC에서 SciChart Demo 플레이해보세요.
-
BlueStacks 다운로드하고 설치
-
Google Play 스토어에 로그인 하기(나중에 진행가능)
-
오른쪽 상단 코너에 SciChart Demo 검색
-
검색 결과 중 SciChart Demo 선택하여 설치
-
구글 로그인 진행(만약 2단계를 지나갔을 경우) 후 SciChart Demo 설치
-
메인 홈화면에서 SciChart Demo 선택하여 실행